
Today in private life people track their own sleep-wake cycle, they count the daily steps they take and log how much they drink on average. These days it’s all about data! Preferably accurate to the decimal point.
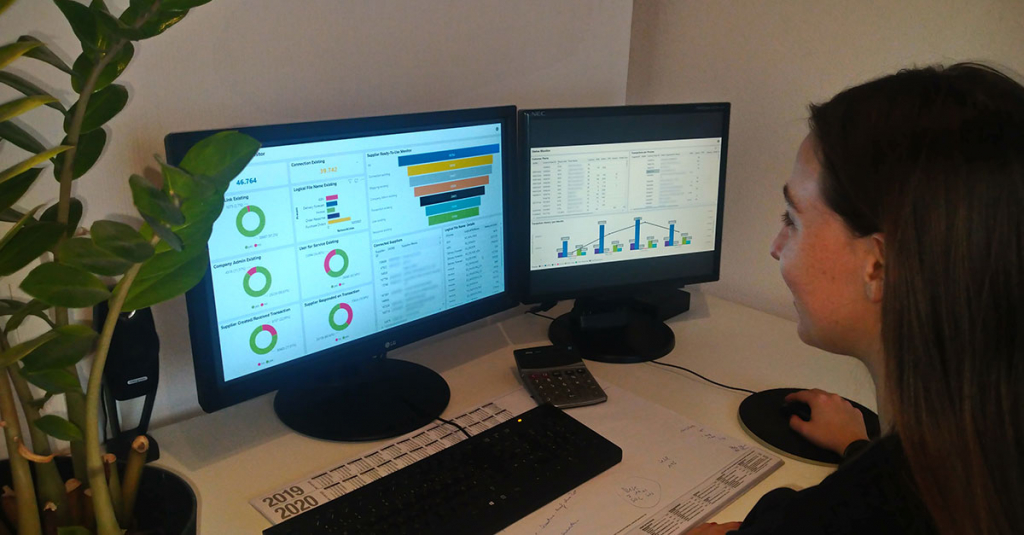
For us at SupplyOn tangible information is essential as well. Especially when a customer wants to check whether and to what extent its suppliers as well as its business units, plants and regions are using SupplyOn solutions. Only through complete and correct use will the customer and supplier highly benefit from the SupplyOn solutions and become beneficiaries of digitization. For this, usage reports provide the required data. These show customers, whether and how its business partners use the different solutions. Learn more about how you can leverage the tool’s capabilities in this article.
What are usage reports?
For all major SupplyOn solutions we provide an associated usage report. These reports visualize data of the supplier onboarding’s progress as well as of the long-term solution use. One report usually consists of three tabs. You can easily switch back and forth between them using a tab bar.
SupplyOn offers, if applicable, the following three tabs (monitors) for each solution:
- Supplier Registration Monitor
- Supplier Activation Monitor
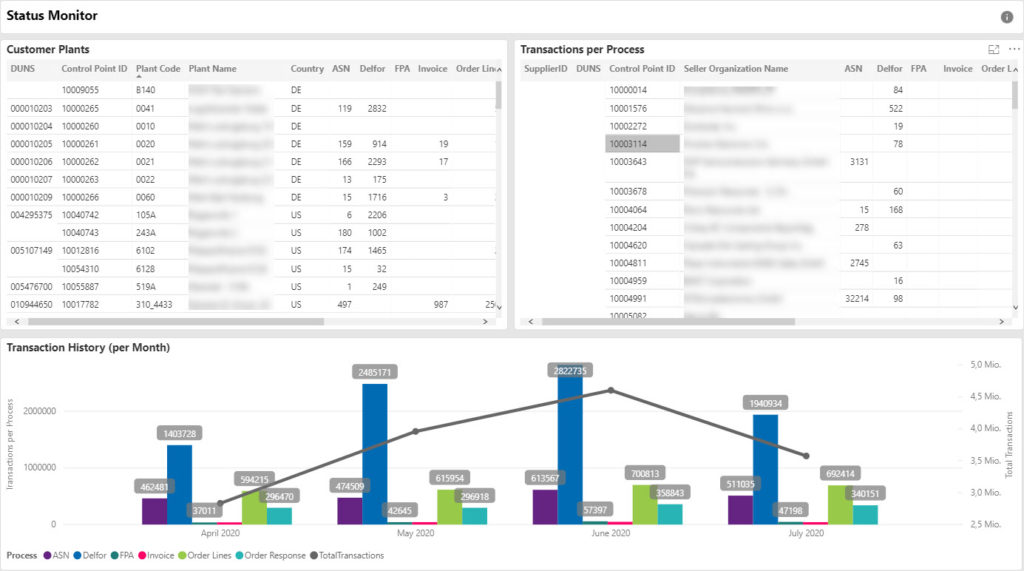
- Status Monitor
Monitoring supplier onboarding: the Registration and Activation Monitor
Before suppliers can start using SupplyOn, they first must be connected to the specific solutions. We aim to provide our customers with detailed information about the current status of the onboarding process at any time. Therefore, each supplier onboarding report contains two special types of monitors.
If you click on the tab Supplier Registration Monitor, you can check how many of your suppliers have already registered and how many are currently going through the registration process. By clicking on the interactive diagrams you can select individual suppliers and look up their registration status.
The second report is the Supplier Activation Monitor. Here you can check if all necessary usage requirements are met in the onboarding process. For example, if a supplier is not assigned to a specific customer plant, there is a gap. Although a supplier would be successfully registered for the customer, it could not receive any messages from this customer plant. For this reason, the tab Activation Monitor has the category “network link existing” in place. Here you can not only see how many of the connected suppliers are already successfully assigned to specific customer plants and how many aren’t. You can also check exactly who these suppliers are. With the help of the Activation Monitor, you can easily detect such gaps and thus take measures for a better usage.
Monitoring long-term use: the Status Monitor
In addition to supplier onboarding, it’s about actually embracing the new digital process and push for optimal use of the digital platform when needed. For this purpose, concrete, up-to-date information on the degree of usage is essential. The usage data of the different SupplyOn solutions is provided and visualized in the tab Status Monitor. This monitor shows up-to-date information, including data on long-term use. Its graphic information provides a quick overview of the usage of the different solutions. Based on this precise data and, thus, transparency, process managers can initiate approaches to improve usage, if necessary.
Disruptions in usage become immediately visible
To reap the savings and process improvements by SupplyOn solutions, these need to be applied broadly and correctly. Here the Status Monitor comes into play. It shows customers possible irregularities in the usage of the different solutions. If, for example, a supplier responds remarkably rarely to requests for quotation, this can be determined by the response rate shown in the monitor. With this information, the customer can now specifically check whether the supplier was even in the right target group or ask him why he repeatedly did not offer and make deductions for further cooperation.
The Management Summary
If you don’t have the time to view the reports on the individual solutions in detail, why not use our Management Summary? Different from the reports presented so far, this report doesn’t consist of the three monitors. It rather gives you a summarizing overview of all your used solutions on one page. Here you can see at a glance how many suppliers are using which solution. In this report as well, you can click on interactive surfaces to get more detailed information.
Customer feedback
With Visibility & Analytics one can have access to a service with a consolidated view, where figures & data can be customized easily according to user needs. The interface is intuitive and practical, whereas the dashboard and the graphics provide an easy to read collection of specific analytics. Reports can be generated using simply the supplier name or ID, thus one can take actions and improve supplier master data.
Alexandra Spătărescu, Process Consultant, Vitesco Technologies Engineering Romania SRL
The usage reports are rated positively by customers and colleagues at SupplyOn alike and are used very extensively. After all, they are an effective tool on the path to digital transformation.