
At a glance
Signals
- Strait of Hormuz risk elevated: MARAD recommends vessels “keep clear” where possible; heightened military activity since 28 Feb 2026.
- Electronic interference is a live hazard: UKMTO flags elevated disruption risk to AIS/navigation/comms in Gulf/Hormuz areas.
- Carrier network actions are constraining capacity: Maersk is rerouting ME11/MECL via Cape and suspending Hormuz crossings “until further notice.”
- Airline traffic down: Airports in Qatar and UAE are closed, impacting up to 20% of EU–Asia air cargo capacities.
- Freight cost adders are now explicit: CMA CGM applies an Emergency Conflict Surcharge from 2 Mar 2026 ($2,000/20′, $3,000/40′, $4,000 reefer).
Implications
- Re-baseline lead times + buffers: assume higher ETA variability (Cape reroutes/port calls) and increase node-specific safety stock for constrained SKUs.
- Increasing seafreight cargo prices and “structural” logistics inflation: cargo rates likely to increase; Cape diversions require up to ~40% more fuel vs Suez (fuel + ETS + surcharges).
- Air cargo stuck: air cargo under way is stuck on routes between Europe and Asia, breaking the most time-critical transport.
- Tighten compliance screening immediately: EU “snapback” reintroduces restrictions including crude oil/natural gas/petrochemicals and certain metals/equipment; OFAC continues vessel/entity designations tied to Iran petroleum.
0–90 Day Priorities
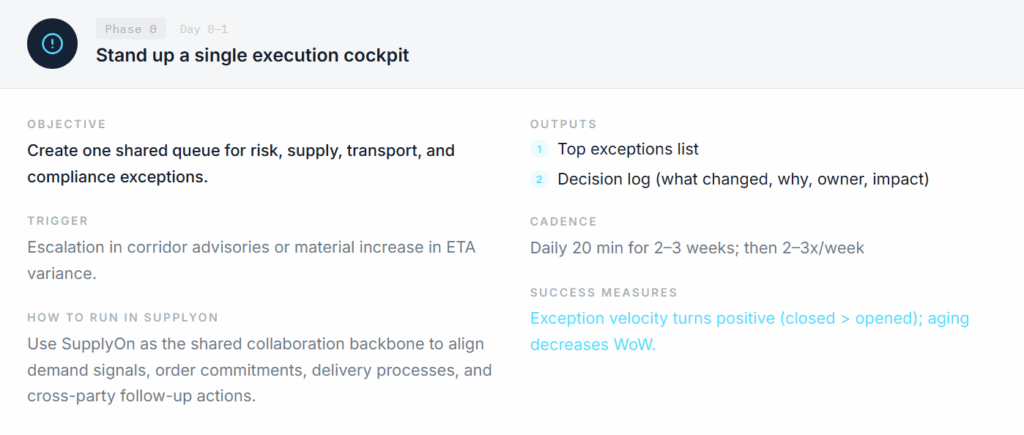
- Stand up a single execution cockpit (Day 0–1).
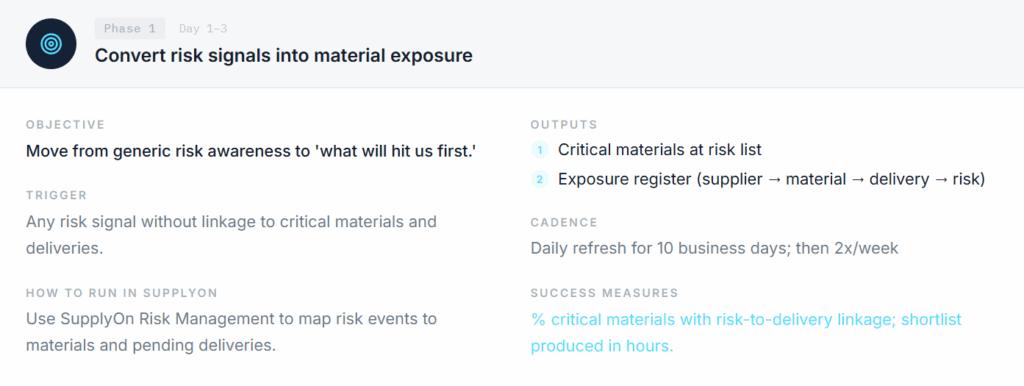
- Map risk events to critical materials and deliveries (Day 1–3).
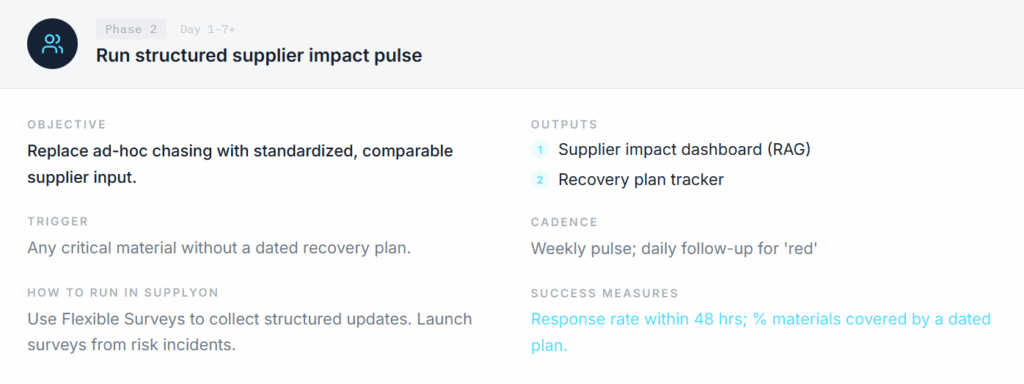
- Run a structured supplier impact pulse with escalation rules (Day 1–7).
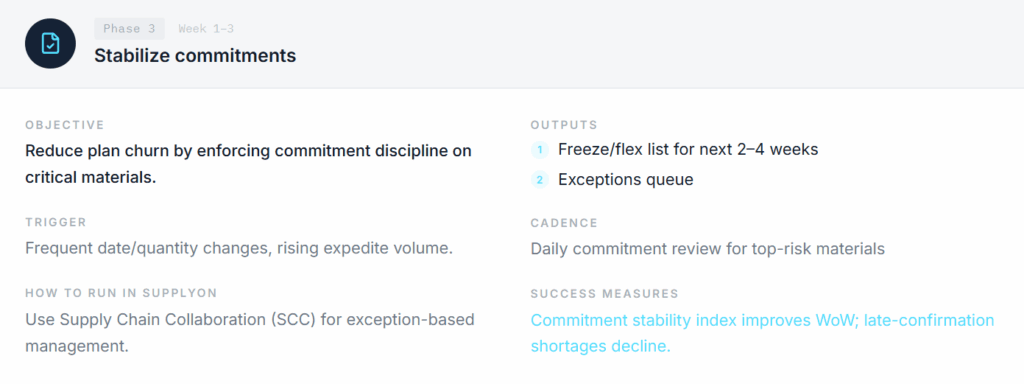
- Stabilize commitments using exception-based collaboration (Week 1–3).
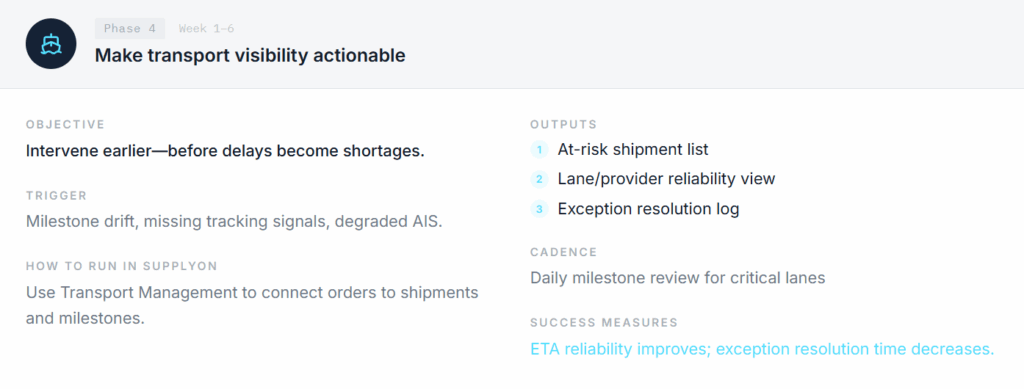
- Make transport visibility actionable with milestone thresholds (Week 1–6).
- Create optionality: reroute, buffer, allocate, or re-source with governance (Week 2–12).
EXHIBIT 0
4 pillars towards a resilient supply chain
Foundation → Maturity → Resilience
A resilience operating model: risk awareness → preparedness → collaboration → visibility.
Situation intelligence: what’s happening from a supply-chain lens
The pattern to recognize: disruption as a reliability shock
In corridor crises, supply chains rarely fail first because a corridor is formally “closed.” They fail because reliability collapses:
- Risk is repriced (insurance and carrier behavior changes first)
- Signals degrade (partial updates, delayed milestones, AIS disruption)
- ETAs widen and become probabilistic
- Exceptions accumulate faster than teams can resolve them
- Premium freight becomes the fallback
Why electronic interference changes operational reality
When AIS and related systems are disrupted, two things happen immediately:
- Transport visibility becomes less deterministic—especially across multi-leg shipments
- Exception load rises because teams must reconcile missing or conflicting updates
This changes the operating requirement from “visibility” to actionable control: milestone governance, exception queues, and faster interventions.
EXHIBIT 1A
The reliability shock chain
How corridor risk propagates through supply-chain operations — and where to intervene
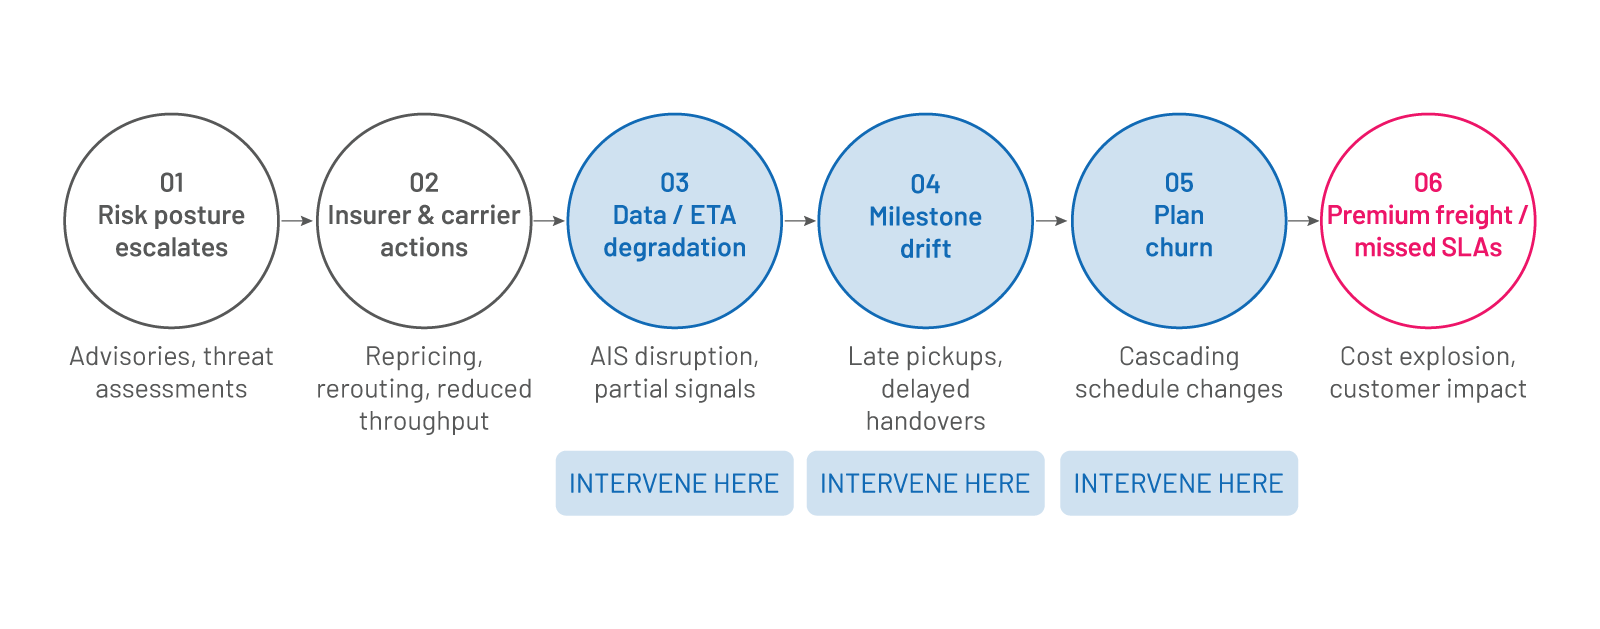
EXHIBIT 1B
Risk management objectives → SCM control points
How corridor risk propagates through supply-chain operations — and where to intervene
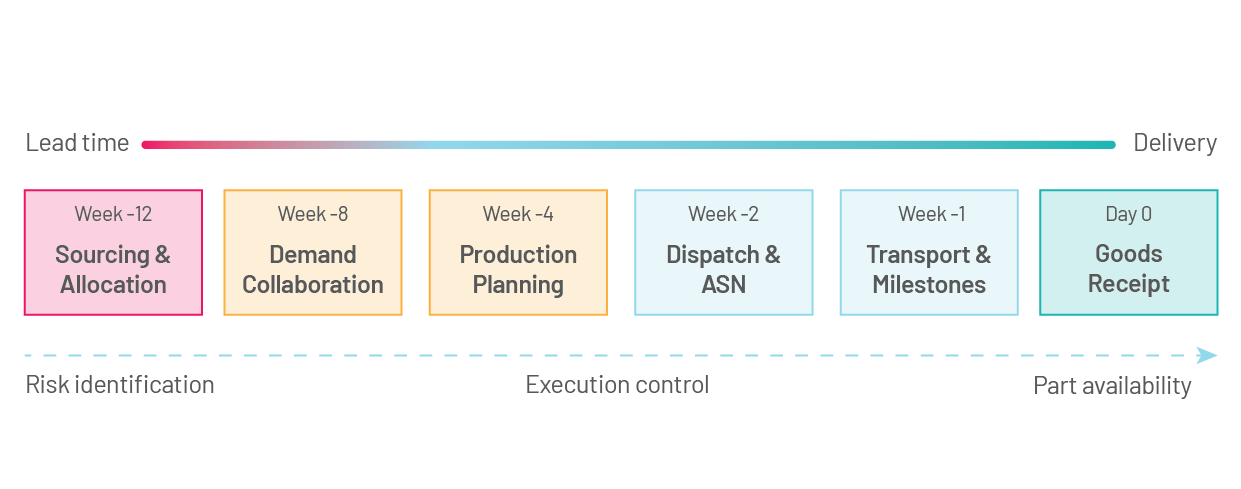
The goal is not ‘risk awareness’—it is faster control at execution points.
Why EU manufacturers feel the impact quickly: transmission pathways
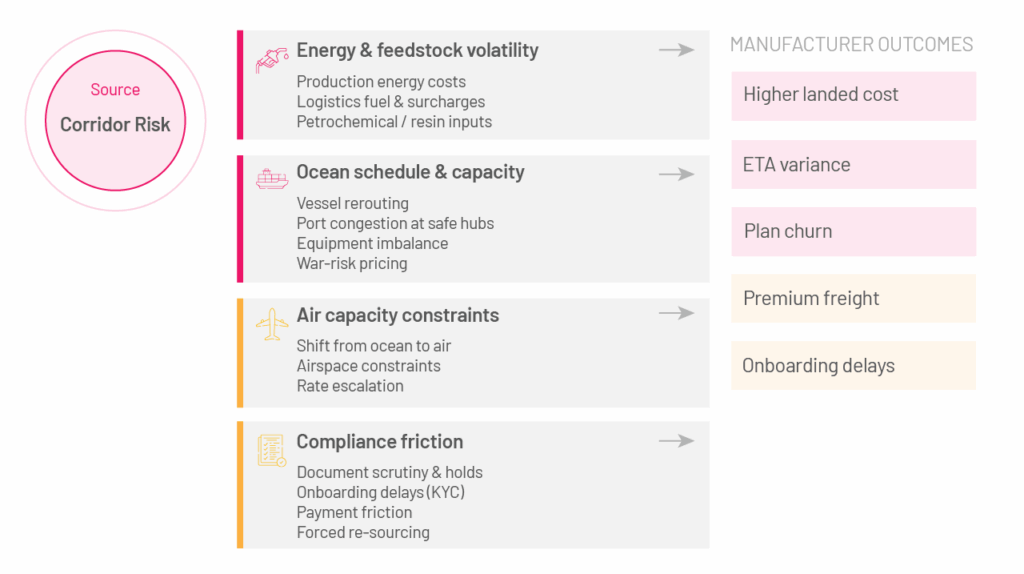
Even without direct sourcing through the Gulf, EU manufacturers are affected through four interconnected transmission pathways.
Pathway A: Energy & feedstock volatility
Energy chokepoints transmit into manufacturing as fast-changing cost inputs (power, fuel surcharges, and petrochemical-linked inputs). The operational response is to protect continuity decisions from being made too late—because cost shocks arrive before shortages.
Pathway B: Ocean schedule integrity and capacity displacement
Carrier networks react globally: rerouting changes transit time distributions, port rotation shifts congestion, and equipment imbalance reduces booking reliability. Plan with wider lead-time bands and pre-approved alternate routings.
Pathway C: Premium freight and air capacity constraints
When ocean reliability drops, demand shifts to air. If airspace constraints exist, the result is an “expedite trap”: higher cost, lower availability, and late interventions.
Pathway D: Compliance friction and counterparty screening
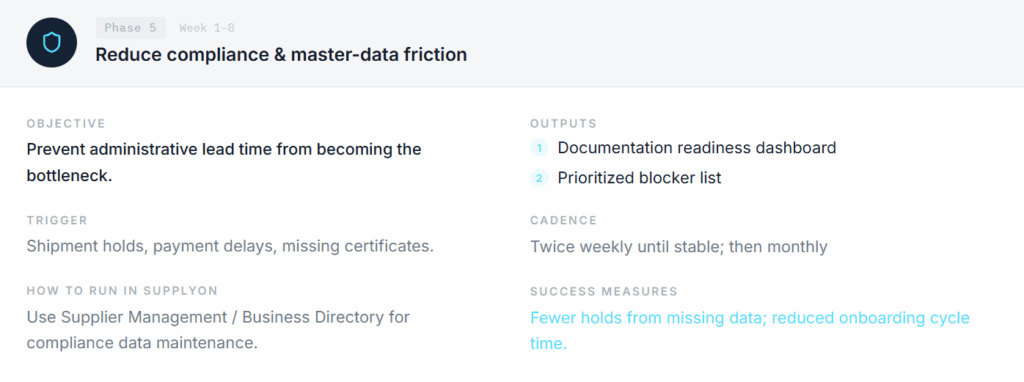
A stricter posture increases document scrutiny and onboarding lead time. Treat compliance readiness like a flow KPI, not a legal afterthought.
EXHIBIT 2
Transmission pathways: corridor risk → manufacturer impact
TRANSPORT PLANNING
Volume forecast → Carrier capacity decisions
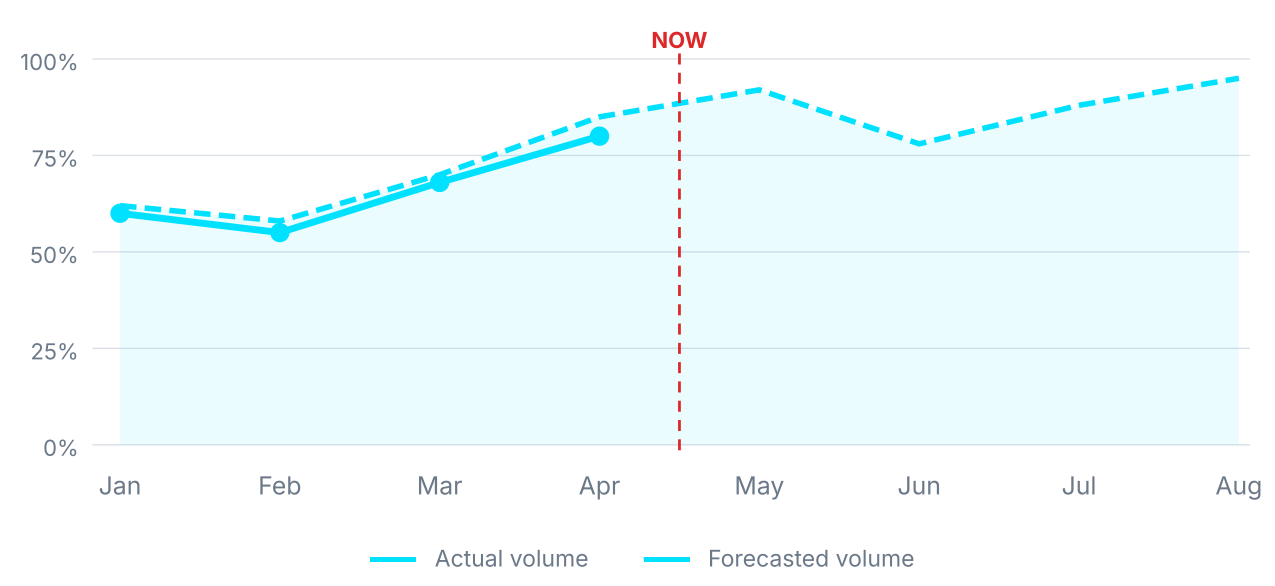
Geopolitical risks are reshaping global supply chains – are you prepared?
What breaks first inside manufacturers: a diagnostic
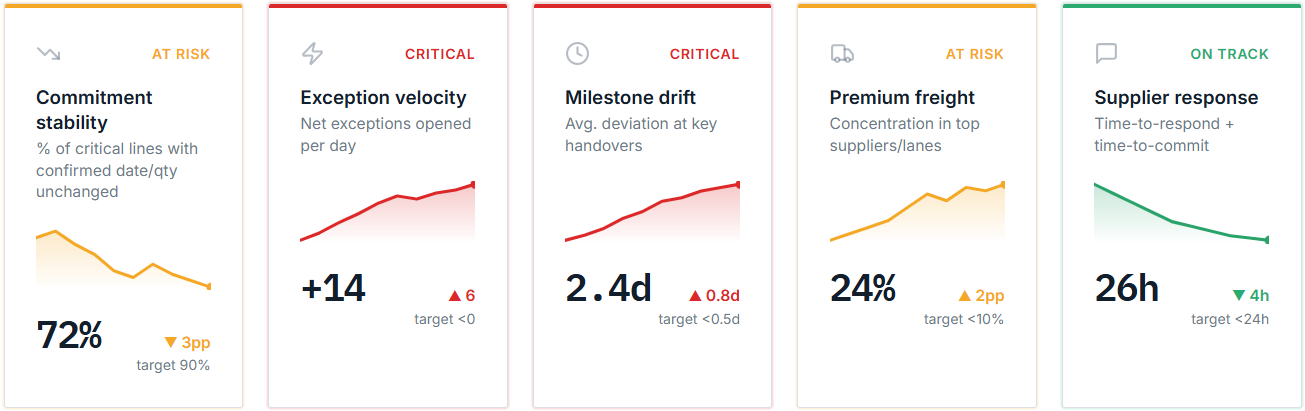
Most organizations detect disruption too late because they track lagging indicators (missed deliveries) rather than leading indicators (plan stability and exception load).
Leading indicators that predict continuity risk
Five leading indicators that predict continuity risk:
EXHIBIT 3
Leading indicators
Root cause behind firefighting: fragmented reference chains
Transport execution tends to break down first where master data quality is low and data platforms are decoupled—creating fragmented reference chains and poor forwarder data quality.
Firefighting anti-patterns
- Parallel email/spreadsheet workflows
- Multiple portals and mismatched IDs
- Late confirmation changes without governance
- Milestone drift not tied to material criticality
The immediate goal: consolidate execution into a controlled loop—detect → prioritize → assign → resolve → learn.
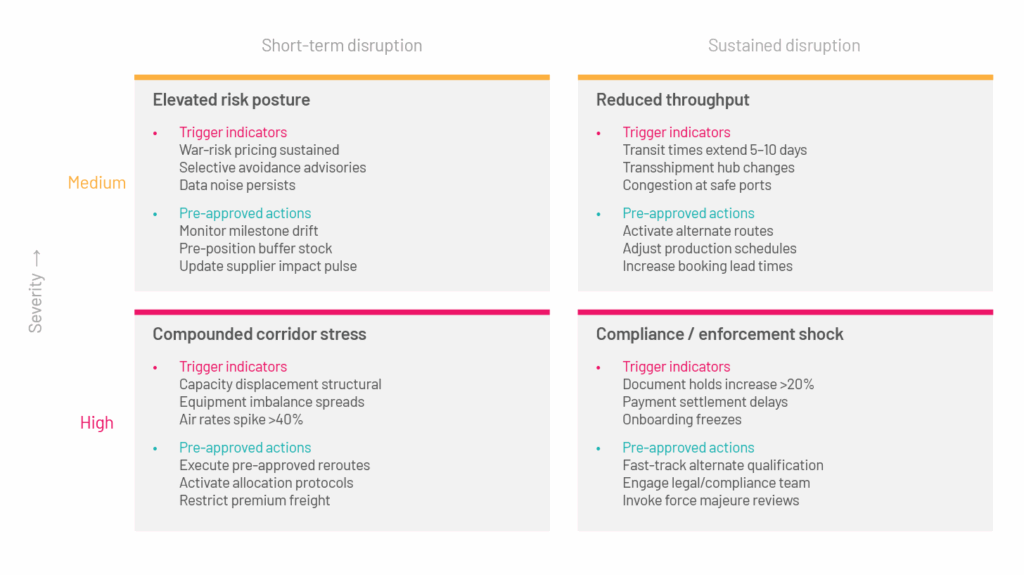
Scenario set: next 4–12 weeks
Rather than betting on a single geopolitical outcome, manufacturers should manage an operational portfolio of scenarios. Each scenario should have trigger indicators and pre-approved actions. Note: thresholds are illustrative—tune to your baseline.
EXHIBIT 4
Scenario matrix
Plan for volatility, not a single forecast
Action planner (0–90 days): run the response in SupplyOn
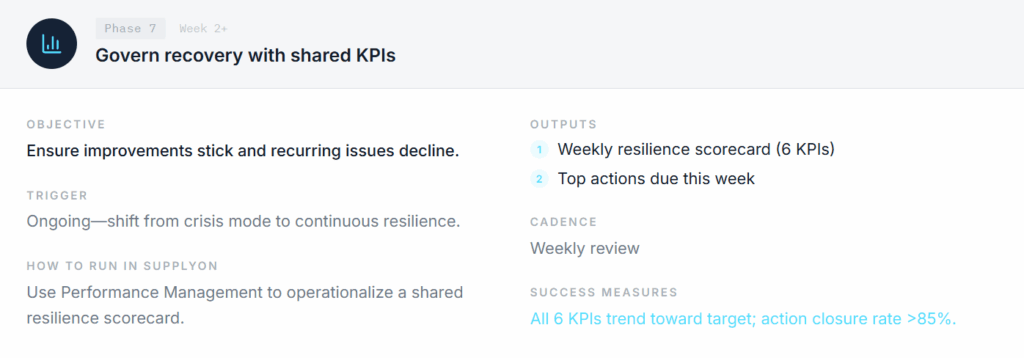
This action planner is structured to be operational—not feature-led. Each phase includes: Objective → Trigger → How to run → Outputs → Cadence → Success measures.
EXHIBIT 5 – ROADMAP OVERLAY
Digitisation as a key to risk prevention: where to start?
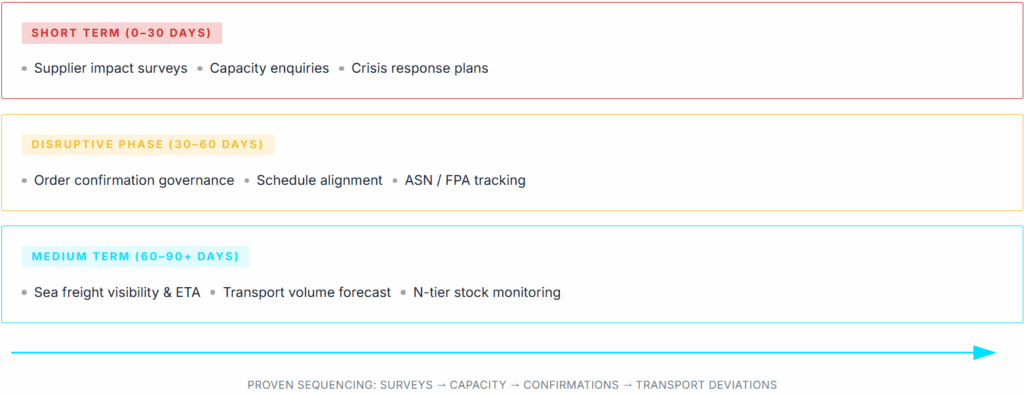
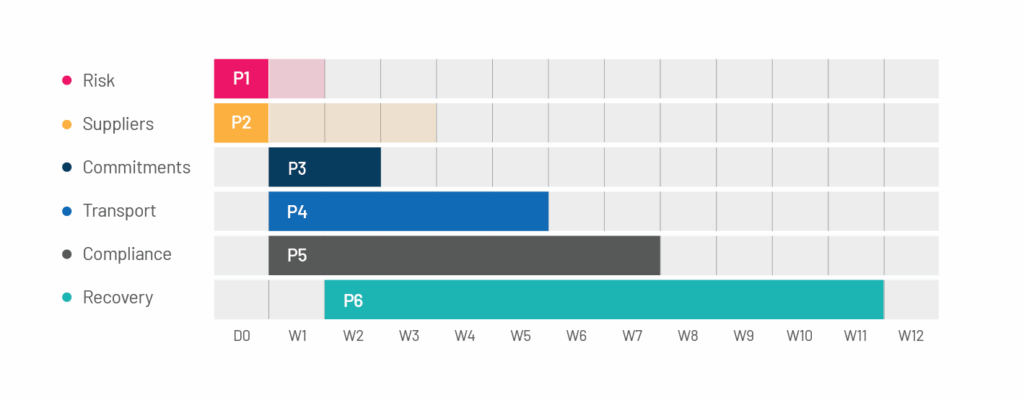
EXHIBIT 6
0–90 day action timeline
Facing growing geopolitical risks in your supply chain?
Just enter your contact details and we will get in touch with you as soon as possible.